
Introduction to Software Engineering Metrics.
Software metrics are an excellent way to assess an engineering team's quality and proficiency. But how do you quantify them?

My name is Michael. I'm a software developer who enjoys blogging and interacting with others about technology.
My work has been included in a variety of publications, including books and periodicals, and I've contributed to a number of open-source projects.
Prior to designing software, I worked in digital marketing. I envision myself working in the blockchain business for the foreseeable future.
The importance of tracking data in everything cannot be overstated after careful examination of how far we've evolved as a species.
Even before the early 1800s industrial revolution, tracking data was critical.
Tracking different data sets is critical in software engineering because it provides an unbiased view of how well a project is doing.
What are Software Metrics?
When it comes to measuring performance and understanding the various strengths and pitfalls of the project, having an idea of every countable measure for your engineering codebase and the product is critical.
Some critical code metrics include tracking the average time it takes to submit pull requests or the rate at which bugs are fixed during the development and production phases.
Cost and time estimation, as well as the number of software developers working on a specific feature, are important metrics for the overall project.
There are critical metrics that we cannot do without at every stage of the software development life cycle.
Metrics such as "feature requests" can be useful in determining user satisfaction with the project and task prioritization.
After releasing your MVP to production, accurate collation, and understanding of user dissatisfaction with specific features can provide insights into which tasks to complete and which features are most valuable. For example, a few months after Twitter launched the "Fleets" feature, it was removed. This was in response to what the general public desired and where engineering resources should be concentrated.
Obtaining Important Metrics
There are numerous metrics that a software team can track, but the most important thing to remember is that only metrics that are critical to the solution of a problem and the progress of the product should be prioritized.
In addition to tracking user satisfaction, code quality is an important metric for almost every company that uses the internet. Metrics for code quality may include the number of lines of code, the number of dependencies used, how automated tests perform, and code redundancy.
Non-technical attention can also be paid to tracking costs and time involved per feature shipped, as well as the efficiency and ROI of different development techniques.
In some cases, a change in strategy for dealing with problems or the use of a specific tool may be required. These seemingly simple decisions can result in significant progress for the team and the product at hand.
Project Management Tools for Measuring Metrics
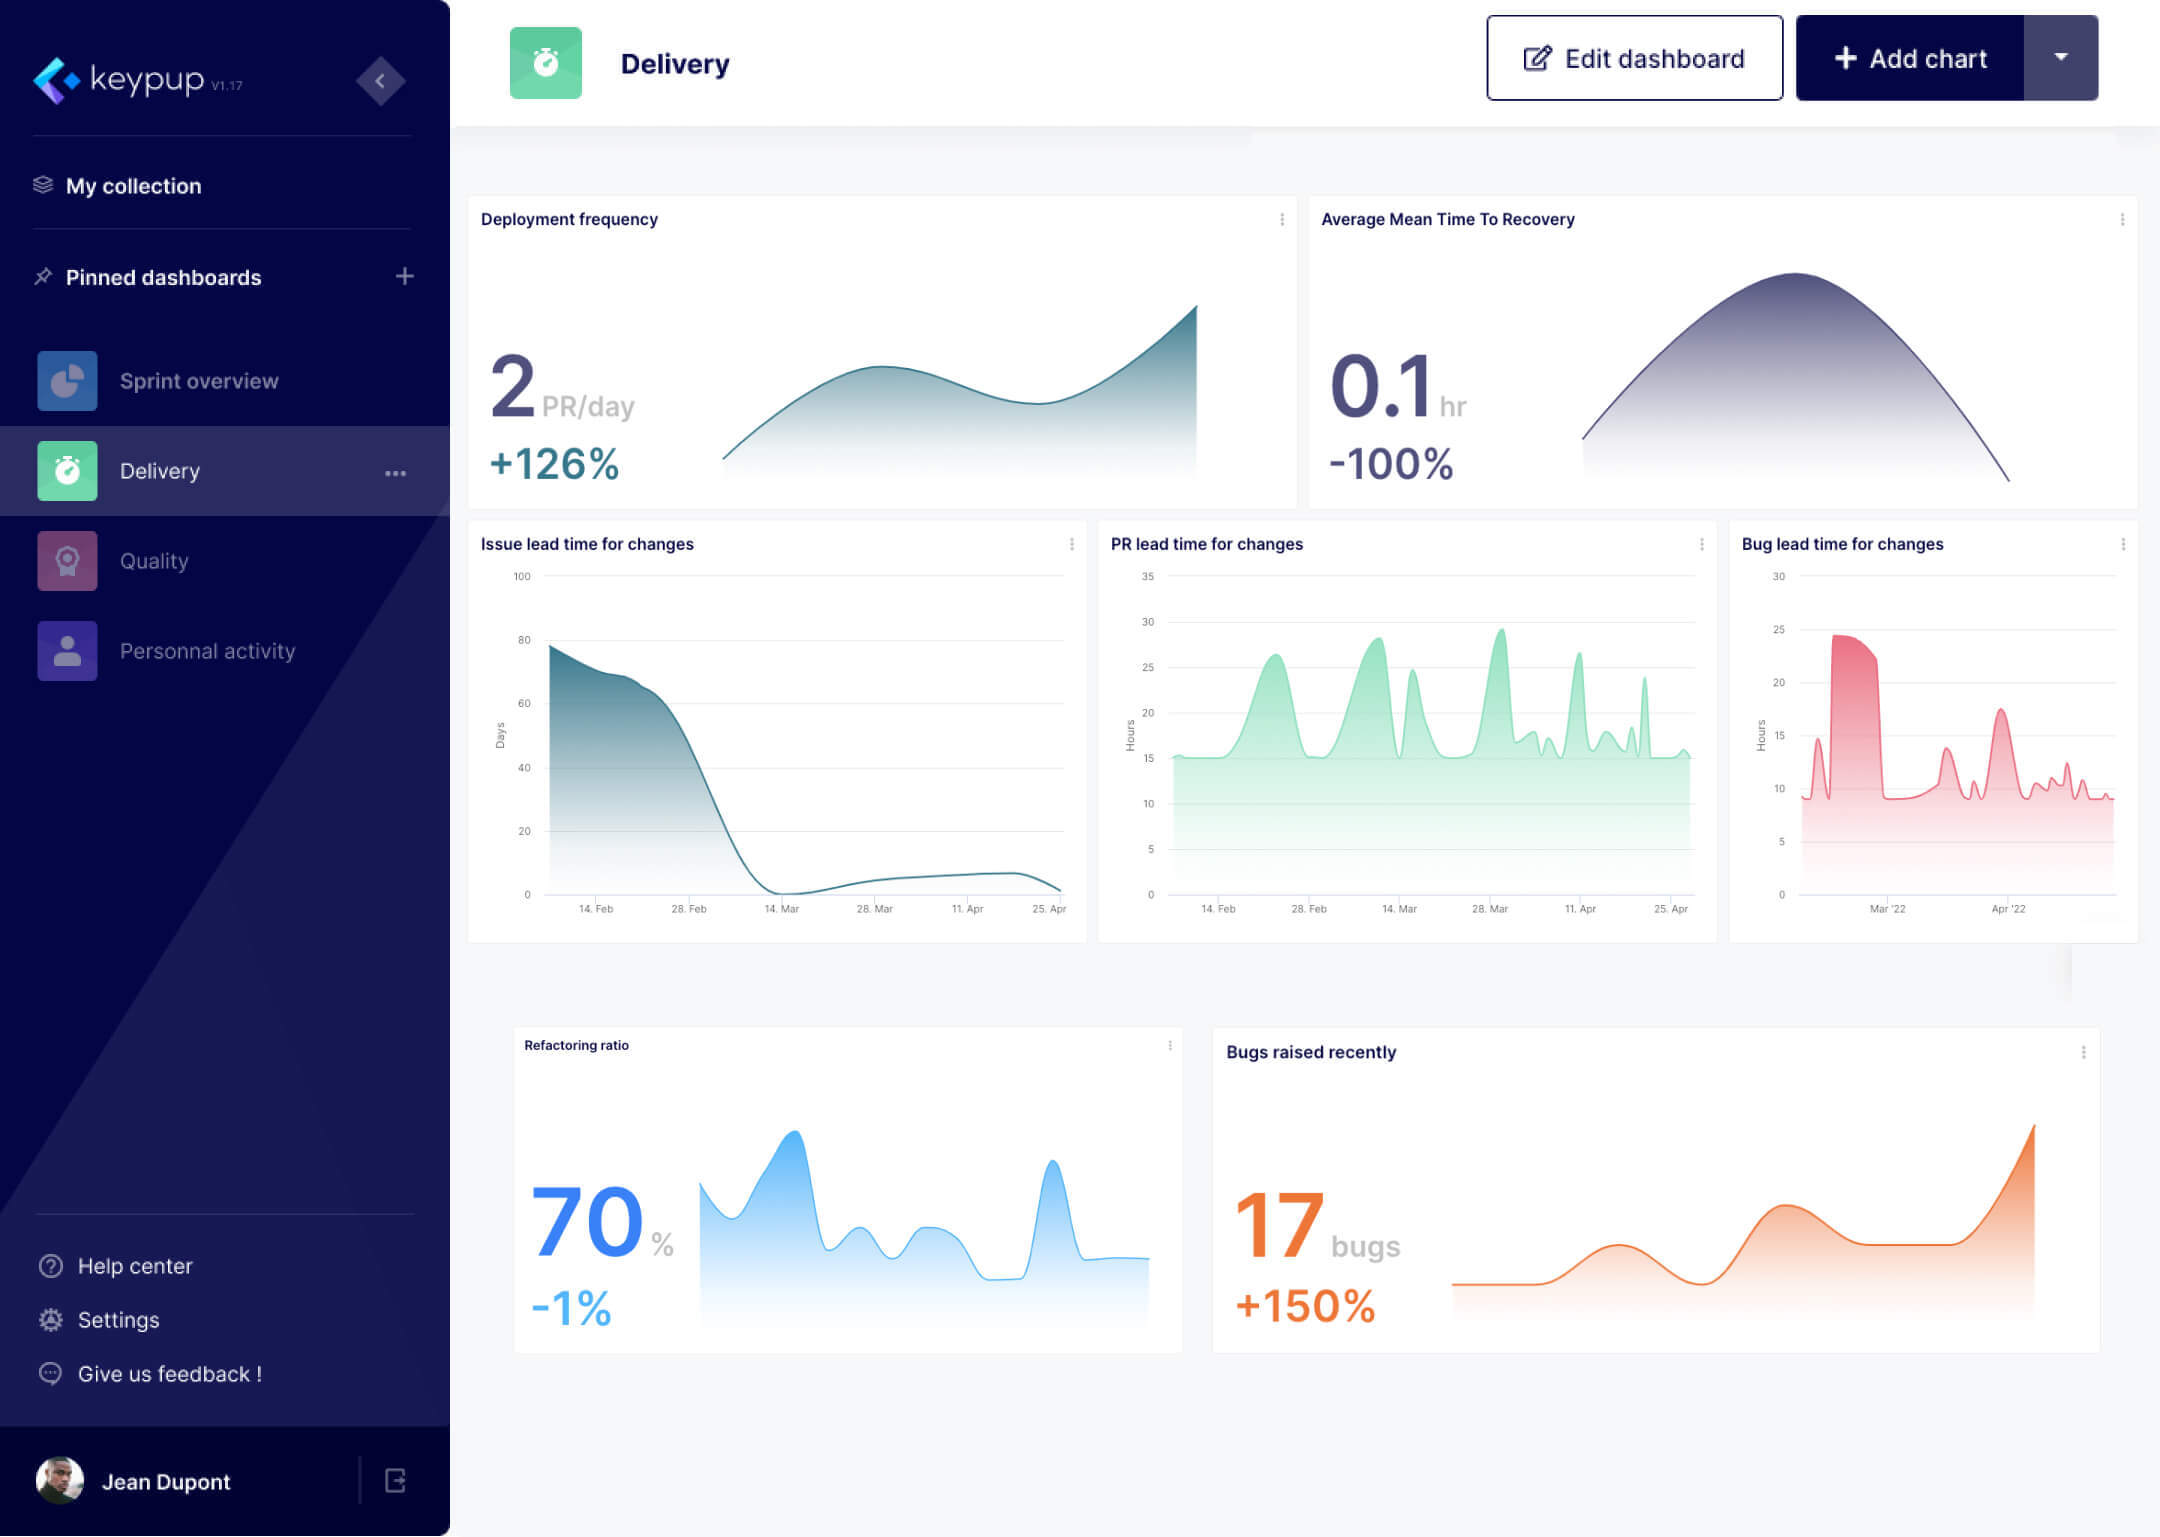
Quantitative data such as the number of code lines and qualitative data such as redundancy are explicitly difficult to check, but tools such as Keypup can easily provide DevOps insights such as DORA Metrics, software delivery metrics, and your development quality.
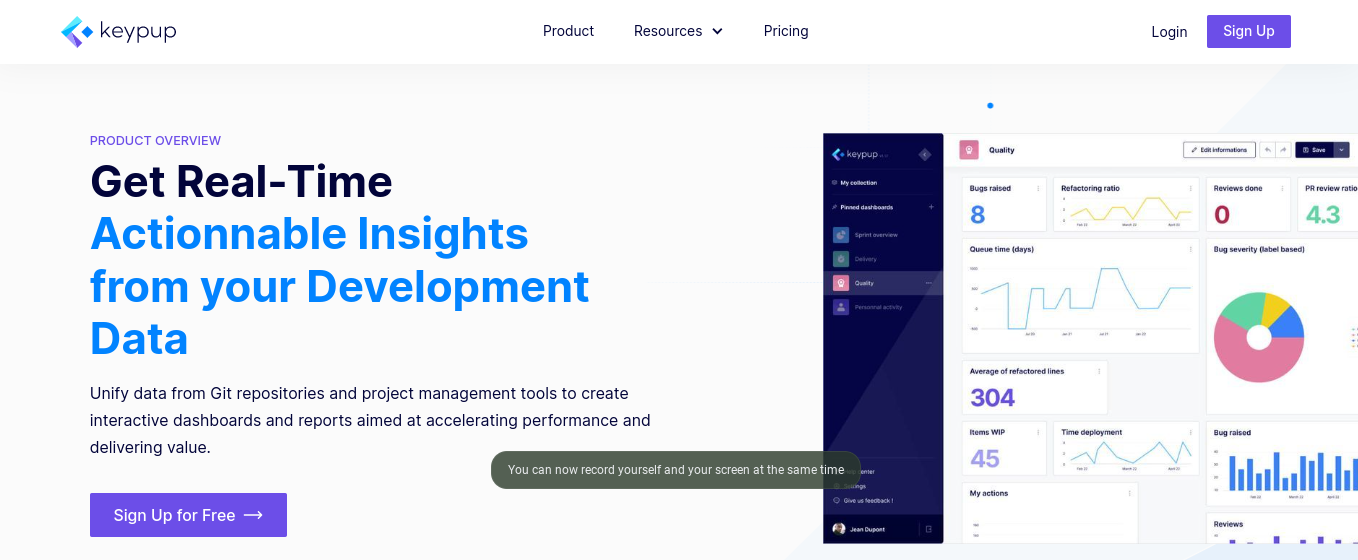
The ease comes from the fact that all you have to do is connect your codebase and the tool will handle the rest.
Introduction to DORA Metrics
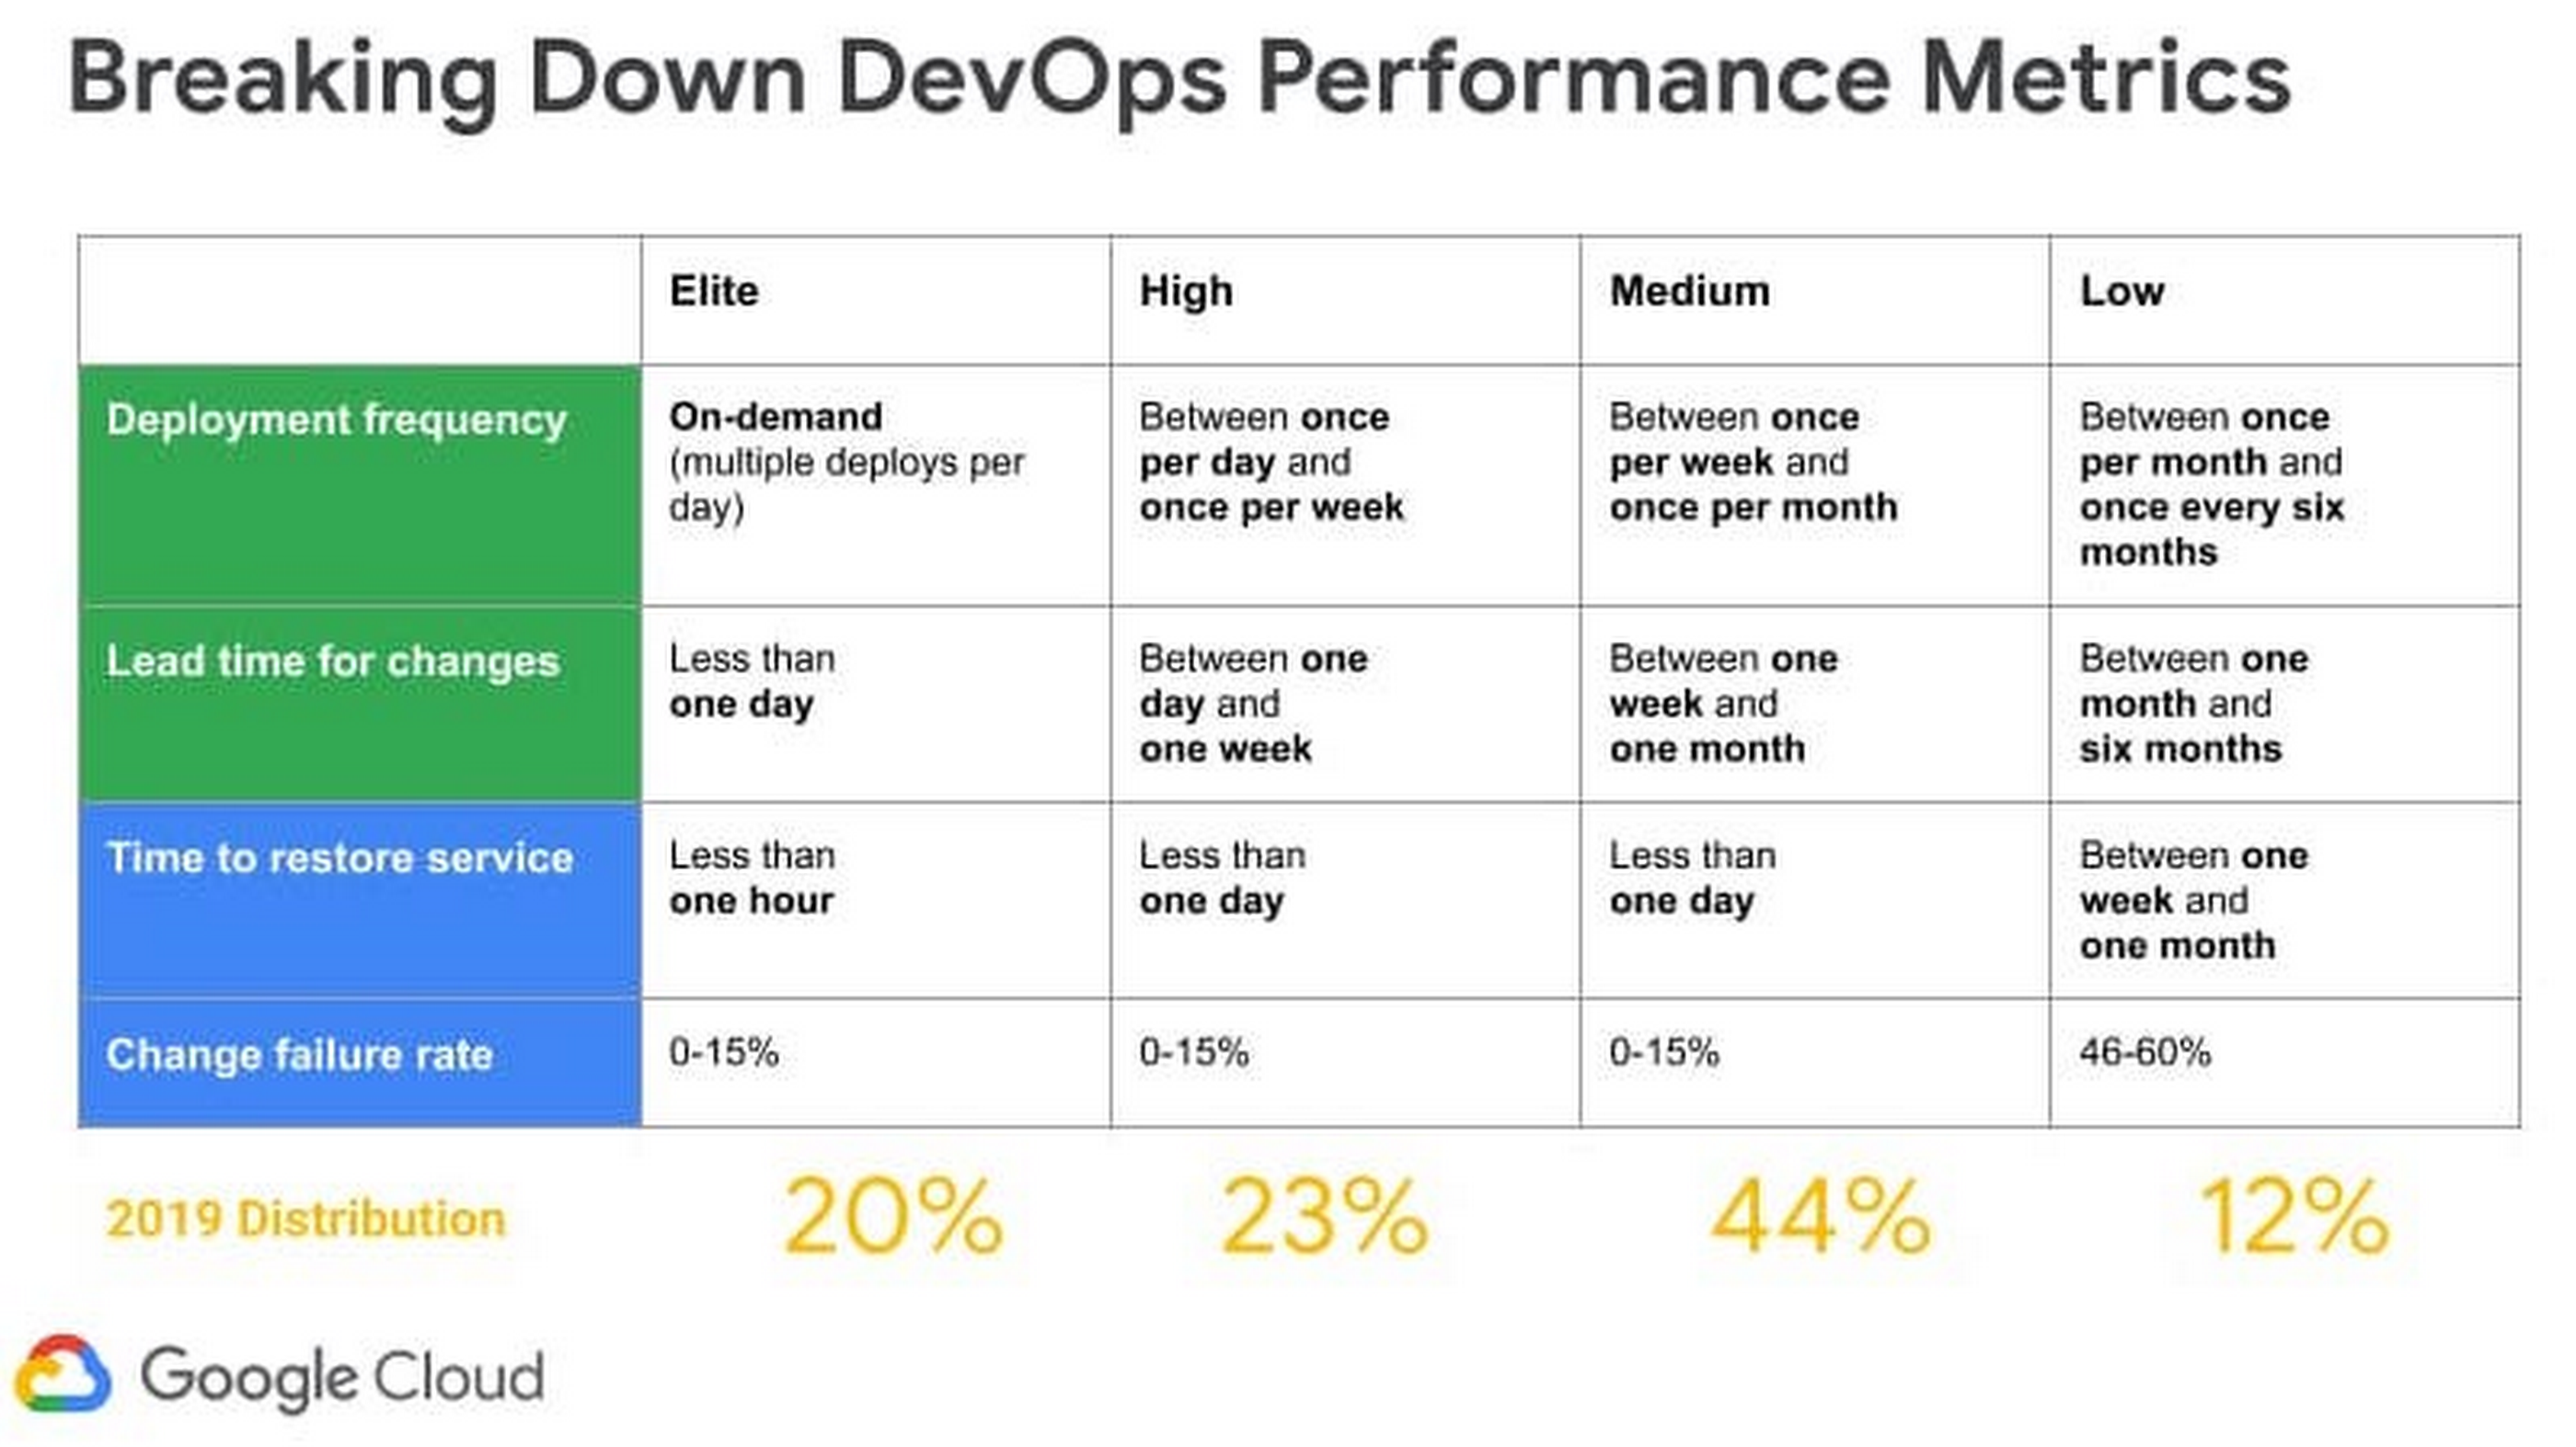
Google's DevOps Research and Assessment (DORA) team spent 6 years developing and providing teams with an in-depth understanding of DevOps practices and capabilities that drive performance.
DORA Metrics employs four key indicators to forecast the efficiency of a DevOps team.
1. Lead Time for Changes(LTC)
How long does it take your team to move from a mockup to a finished product?
The amount of time it takes for an idea to become a usable production is what we are tracking with LTC. Lower lead time means higher customer responsiveness from a customer-centric standpoint.
Elite performers can boast of only a few hours between brainstorming and product development.
Cycle time, which is a subset of lead time, is the amount of time it takes to make changes to a software system and ship it ready for use.
2. Deployment Frequency(DF)
In simpler terms, we can think of DF as the consistency with which a team deploys and delivers features.
DF is an important metric because it makes a team aware of its goals and progress.
Shipping in batches can help teams with complex codebases improve their DF. The advantage is that it improves bug fixing and identifies code issues.
For a larger team, the frequency can be reduced to ensure that all team members move at the same rate.
3. Mean Time for Recovery(MTTR)
This is a critical metric for determining how well the software performs in production.
Code problems are inherent, and this can provide insight into how long it takes for the systems to recover.
In terms of security, MTTR can be defined as the time it takes to fix a breach. The MTTR for elite performers is less than an hour.
4. Change Failure Rate (CFR)
Basically, CFR is the amount/ percentage of releases that result in downtime.
This is very important because it accurately tells how effective a team is at implementing safe changes.
The caveat here is that team with low DF can have a great CFR which may be misinterpreted as a win or progress or to be considered as an elite performer.
As such, CFR is best measured in percentage.
This rate of percentage is calculated based on how frequently you are deploying. Elite performers have a high DF but a lower CFR(0-15%).
DORA Metrics considers various indicators throughout the software development lifecycle to determine whether a team is an elite or a low performer.
The chart below depicts a Google Cloud distribution for 2019.
Conclusion
Software metrics are an excellent way to assess an engineering team's quality and proficiency.
Technical leaders and CTOs must be able to select and evaluate the appropriate metrics for their purpose and goals.
Other important metrics to consider include code churn and reactors, efficiency, and other security metrics.
More of my articles can be found here. Thank you very much!


